Advanced Reporting provides simple, customizable metrics for users who want to get detailed information on how their restaurant is performing.
With Advanced Reporting, you can:
- Create and save custom reports from preexisting templates or build your own.
- Quickly see how your restaurant is performing with intuitive graphs and tables.
- Easily export any report to PDF and/or Excel. Some of the sections can also be exported to CSV.
Advanced Reporting is an additional module that must be enabled on your account by Lightspeed.
 To access Advanced Reporting
To access Advanced Reporting, click Reports > Advanced Reporting.
To create a new report
- Click Create New report.
- Give the report a name.
- Optionally filter by floors, tables, users and/or shifts.
- Click Create.
- Drag report sections from the list to the Drag any component here box. See Available Report Sections for full descriptions.
- To move a section within the report, hover over the section and hold the move icon while dragging the section upwards or downwards.
- To adjust section specific settings, click the settings icon in the top-right of that section. Select or deselect individual settings and then click Save.
- To delete a section from the report, click the delete icon in the top-right of the section. Click Yes to confirm.
- Click Save in the top-right of the window to save the report.
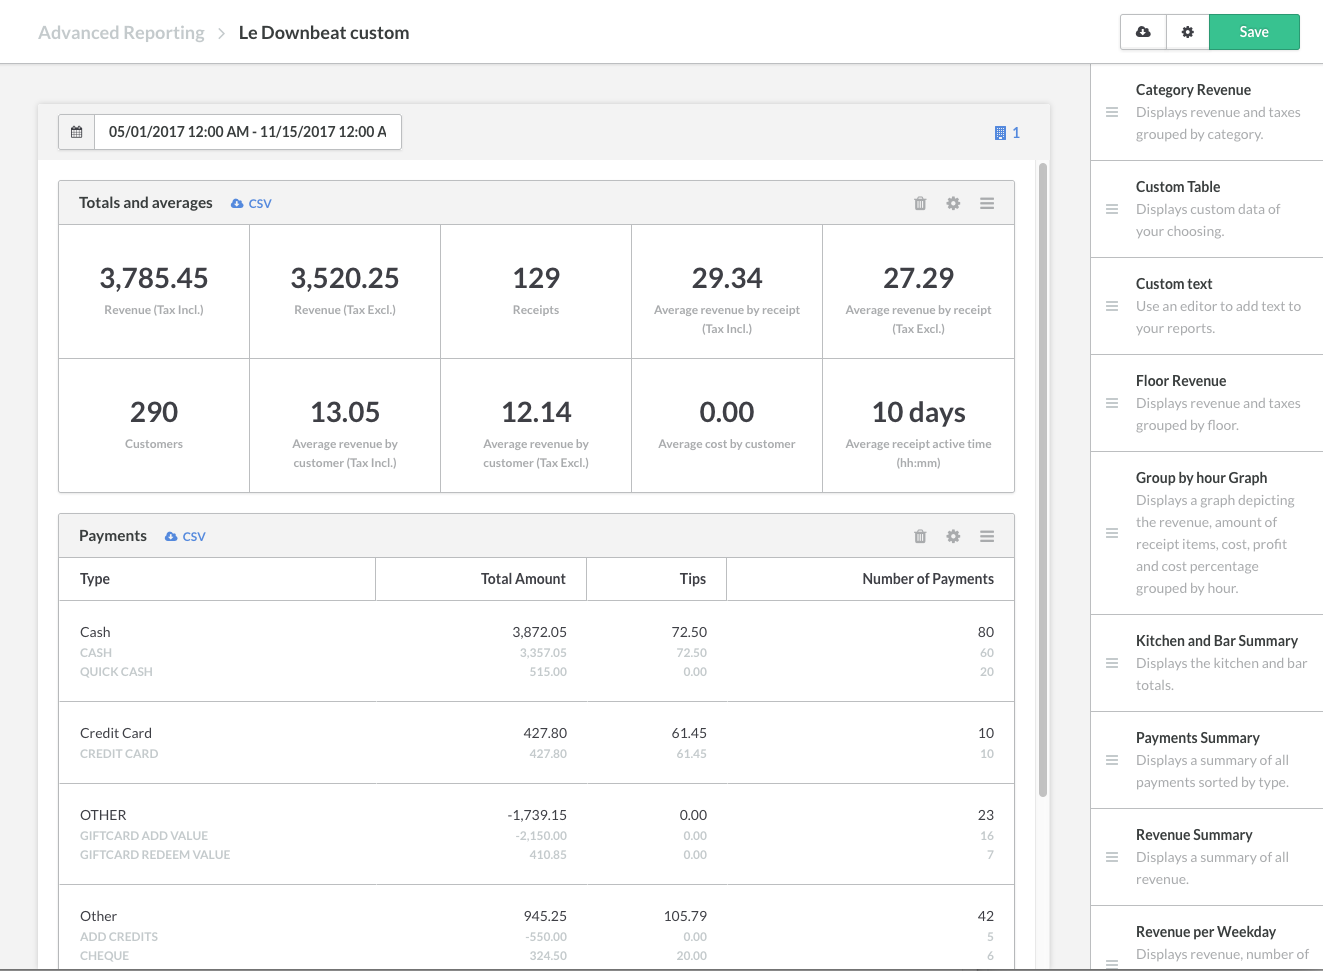
To open a saved report
- Access the Advanced Reporting section in Restaurant Manager.
- Select and click the saved advanced report from the list.
To set the date range
- Click the date bar at the top-left of the report window.
- Select a date range by clicking a start and end date.
- Specify the time of day.
- Click Apply.
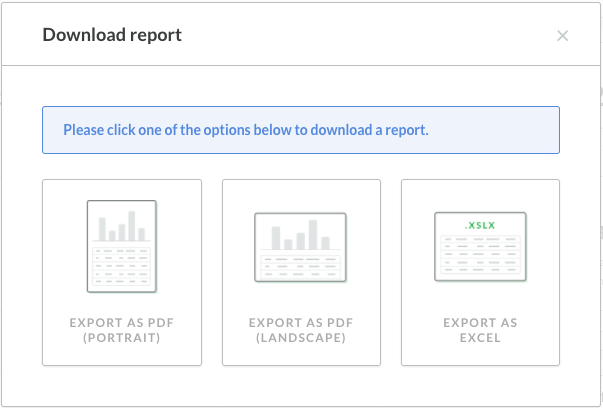
To download and export a report
- Save a new report or open a saved report.
- Click the download icon in the top-right corner.
- Select a download format.
- Export as PDF - Portrait
- Export as PDF - Landscape
- Export as Excel
Available report sections
| Category Revenue |
A section showing the revenue and taxes grouped by category for any period of time. Can be filtered by shortcut categories or category types, with or without discounts. You can also show revenue for the modifiers associated with a product. |
| Custom Table |
A section where you can display custom data of your choosing. |
| Custom Text |
A section with an editor to add text to your report. |
| Floor Revenue |
A section showing the revenue and taxes grouped by floor. |
| Group by hour Graph |
A graph illustrating the revenue, amount of receipt items, cost, profit and cost percentage broken down by hour. |
| Kitchen and Bar Summary |
A table showing the totals for the kitchen and bar. Can be grouped by category, food and drinks, or specific categories. |
| Payments Summary |
A section showing a summary of all payments received within the selected date range. |
| Revenue Summary |
A section showing a summary of all revenue received within the selected date range. |
| Revenue per Weekday |
A table showing total revenue, average revenue, number of tickets and their averages per weekday. |
| Table Revenue |
A section showing the revenue and taxes grouped by table. |
| Tax Summary |
A section showing a summary of all tax collected within the selected date range. |
| Tips Summary |
A section showing a summary of all tips received, contributions to a tip pool, money owed for credit card processing and total tips earned. |
| Top 5 selling graph |
A graph illustrating the top 5 best and worst selling items. |
|
Totals and Averages
|
A section showing a snapshot view of your totals and averages. For example: receipts, customers, average revenues and taxes. |
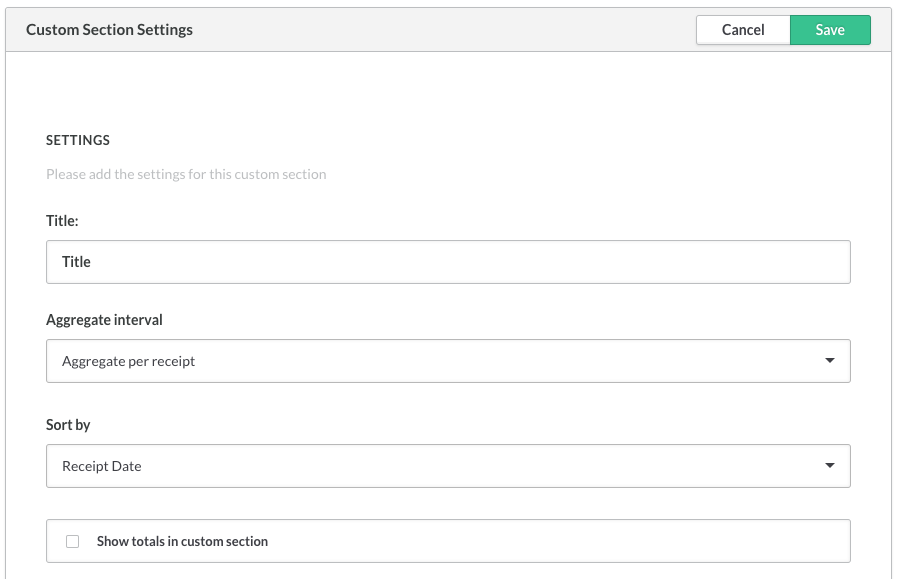
Creating a Custom Table section
The Custom section can be a great tool to help you create an individualized report to match your Restaurant's specific needs.
- Drag and drop the Custom Table section from the sections list.
- Click the Settings button to open the Custom Section Settings popup.
- Give the section a title.
- Select an Aggregate interval criterion from the drop-down menu:
- Aggregate per receipt
- Aggregate per day
- Aggregate per month
- Select a Sort by criterion from the drop-down menu:
- Receipt date - displays report in chronological order.
- Receipt ID - organizes content by receipt ID.
- Total amount of receipts
- Total amount of items
- VAT total
- Discount total
- Create the dynamic columns.
- Click Add Column.
- Select the Column Type from the drop-down.
- Give the field column a header name.
- Select one of the following options if you Column Type is a Field:
- Receipt date
- Receipt ID
- Total amount of receipts
- Total amount of items
- VAT total
- Discount total
- OR: Select one of the following if your Column Type is an Aggregate. An aggregate is the sum of certain characteristics or fields.
- Category Tax Incl.
- Category Tax Excl.
- Payments Total (Payments Amount + Payments Tips)
- Payments Amount
- Payments Tips
- Number of payments
- Net per tax rate
- Tax per tax rate
- Total per tax rate
- Select one of the following options if you Column Type is a Field:
- In the Filter on box, you can opt to narrow down the data to specific product categories. For example, Drinks.
- Click Ok to add your column.
- Click Save in the top-right corner of the Advanced Reporting window.